Your 20-Minute Monthly Marketing Report: 5 Metrics Every Small Business Owner Needs to Check
Oct 25, 2025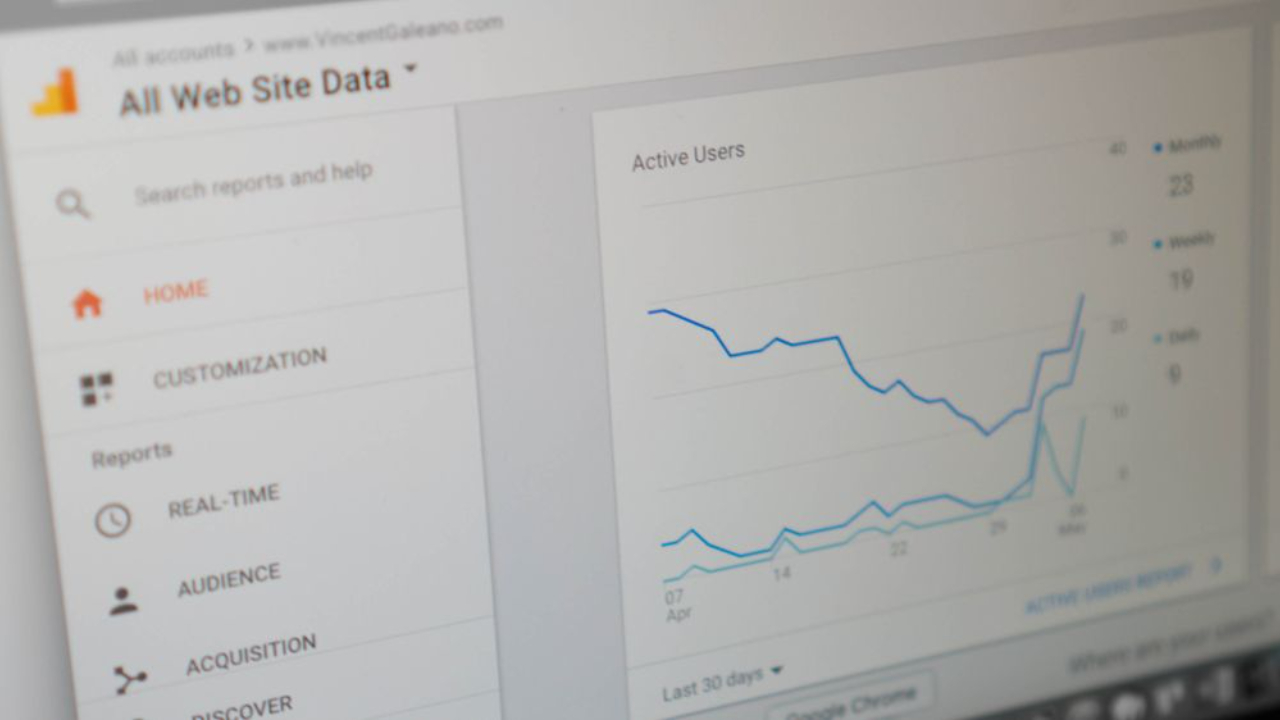
Last updated: April 2026 · Written by 20 Minute Marketing · 8 min read
You only need to track 5 metrics to gain 80% of the clarity you need about your marketing performance. Checking these five numbers once a month takes 20 minutes and tells you exactly what's working, what's failing, and where to focus next month — without getting lost in a sea of data.
Most small business owners either never look at their data, or log into Google Analytics, feel overwhelmed, and close the window without learning anything. This 20-minute monthly report solves that. Log into your dashboards, grab a coffee, and let's make sense of your marketing.
Metric 1: Overall Site Traffic and Source (5 Minutes)
📘 Want the full picture? Read our the 20-Minute Marketing system — the complete pillar guide this article is part of.
Where to look: Google Analytics (GA4) → Acquisition → Traffic Acquisition
What to check:
- Total users/sessions: Is the overall number going up, down, or flat compared to last month?
- Top channels: Which source sends the most traffic? (Organic Search, Direct, Social, Paid)
- Channel trend: Is your dominant channel growing or shrinking?
The takeaway: If Organic Search is lagging, focus next month on SEO and content creation. If Social is strong, double down on those platforms. If Direct traffic is high, you have strong brand recognition — protect it with email marketing to own that relationship. If no channel is growing, your visibility problem is top-of-funnel. Start with our free SEO strategy to 10x your website traffic.
Metric 2: Website Conversion Rate (5 Minutes)
Where to look: Google Analytics → Conversions (requires goals set up), or count form submissions manually from your CRM/email inbox if GA4 conversions aren't configured
What to check:
- Total conversions: The raw number of goal completions (form fills, calls, bookings)
- Conversion rate: Conversions ÷ total visitors × 100. If 1,000 visitors and 20 enquiries, that's a 2% conversion rate.
The takeaway: A conversion rate below 1% means your website has a problem — typically unclear value proposition, no visible CTA, or too much friction in the enquiry process. Fix the website before spending more on driving traffic to it. Most AU small business service websites should target 2–4%. Top performers achieve 5%+.
Why this matters most: Increasing traffic from 1,000 to 2,000 visitors with a 2% conversion rate gives you 40 leads. Keeping 1,000 visitors but improving conversion rate from 2% to 4% also gives you 40 leads — for zero additional marketing spend. Conversion rate optimisation is often the highest-ROI marketing action available. See our website conversion checklist to diagnose and fix common issues.
Metric 3: Top Performing Content (5 Minutes)
Where to look: Google Analytics → Engagement → Pages and Screens
What to check:
- Top pages by views: Which pages are getting the most traffic?
- Top exit pages: Which pages are people leaving from most frequently? (A high exit rate on a service page is a serious problem.)
- Engagement time: Are visitors spending enough time to actually read your content?
The takeaway: If one blog post is getting 80% of your traffic, write three more on related topics. If a key service page has a high exit rate, it needs better content, a clearer CTA, or improved trust signals. Content data tells you where your audience is interested and where your website is failing to hold them. Then find low-competition keywords to build that next batch of content.
Metric 4: Local Search Visibility (3 Minutes)
Where to look: Google Business Profile Dashboard → Performance
What to check:
- Total searches: How many times did your profile appear in Google Search or Maps this month?
- Actions taken: Calls made, website visits, and direction requests initiated from your profile
- Search vs Discovery: Are people finding you by name (branded) or by category/keyword (discovery)? Discovery is more valuable for growth.
The takeaway: High searches but low actions (calls, clicks) means your profile isn't compelling enough — old photos, missing description, no recent reviews. High actions but flat search numbers means you're converting well but not reaching new audiences — focus on review velocity and weekly GBP posts to expand reach.
Metric 5: Social Media Engagement Health (2 Minutes)
Where to look: Instagram/Facebook/LinkedIn Insights → Content Performance
What to check:
- Average engagement rate: Interactions (comments + shares + saves) ÷ reach. Not likes — saves and shares indicate genuine value.
- Best performing post this month: What format, topic, and style generated the most saves or shares?
- Follower growth: Is your audience growing or stagnant?
The takeaway: An engagement rate below 2% means your content isn't resonating — adjust your format, topic mix, or posting time. If saves and shares are high on one post type, make more of it. Saves beat likes as a quality indicator — a saved post means someone found it useful enough to reference again.
Your Monthly Action Rule
After reviewing the five metrics, ask one question: which metric is the weakest? That metric becomes your primary focus for the next 30 days.
| Weakest metric | Focus for next month |
|---|---|
| Traffic (Metric 1) | Content creation, SEO, or paid advertising to increase visibility |
| Conversion rate (Metric 2) | Website CRO — clearer CTAs, trust signals, faster load speed |
| Content performance (Metric 3) | More content on topics driving traffic; fix high-exit pages |
| Local visibility (Metric 4) | GBP optimisation — reviews, photos, posts, services list |
| Social engagement (Metric 5) | Content strategy reset — different formats, topics, or posting times |
Frequently Asked Questions
Should I check these metrics daily or weekly instead of monthly?
For most small businesses, monthly is the right frequency. Daily data is mostly noise — a traffic drop on a Tuesday doesn't mean anything without context. Monthly data shows real trends and gives you enough data to make confident decisions. The exception: if you're running active paid advertising campaigns, weekly checks of ad performance metrics (CPC, ROAS, conversion rate) are appropriate.
What if I haven't set up Google Analytics yet?
Set it up before doing anything else. GA4 is free and takes about 30 minutes to install on most websites. Without it, you're flying completely blind. See our GA4 setup guide for small business for the step-by-step process. In the meantime, start with the two metrics you can track without GA4: GBP performance (from your GBP dashboard) and social engagement (from platform Insights).
Get the complete monthly marketing report template — pre-built for Australian small business.
Open the Essentials Course →20 minutes a day is all it takes.
The 20 Minute Marketing course is built for small business owners who don't have hours — get a step-by-step daily system that actually moves the needle.
Start Your Marketing Journey →
Built for time-poor Australian small business owners.
You'll never need a Marketing Agency again!
Digital Marketing Courses that teach you more than an Agency ever could (or would!)